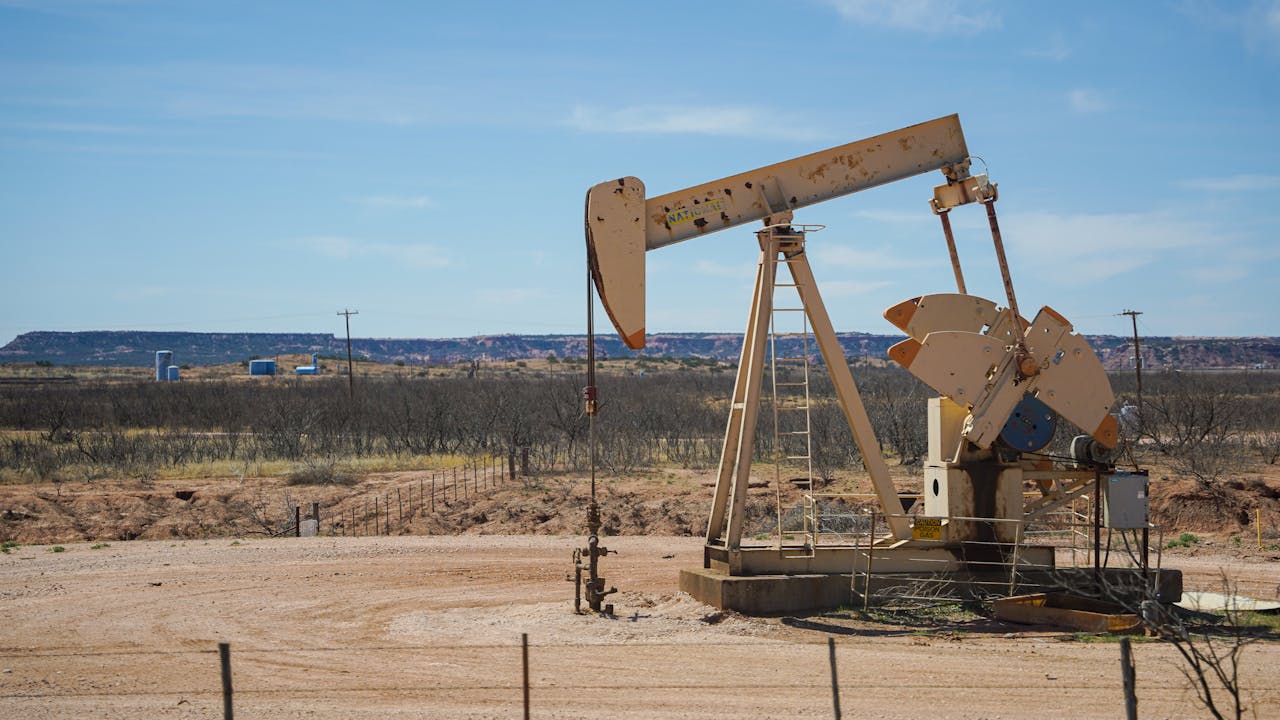
Oil's geopolitical bid is unwinding faster than the positioning data can print it. WTI is trading near $76.5 and Brent near $80.7 after both lost more than 10% over two sessions, a collapse triggered by a Qatari-drafted interim proposal and Treasury Secretary Scott Bessent's flag that a deal to reopen the Strait of Hormuz could land “today or tomorrow.”
The tell is not the spot move — it is what sits underneath it. Managed money was carrying a war premium it built in a single week, and the last Commitments of Traders (COT) snapshot caught that length near a local peak right before the rug came out.
A War Premium Built in a Single Week
Into the late-July escalation, speculators piled in. The latest CFTC data (positions as of July 28) shows managed-money net length in WTI at roughly 108.3K contracts, up from about 86.9K a week earlier — a 21.4K jump.
The broader non-commercial speculative net long ran even hotter, swelling to around 120.1K from 81.7K, a 38.4K one-week build. That is late, fear-driven money chasing a supply-disruption tail, and it is precisely the kind of crowded, one-directional positioning that turns a headline reversal into a cascade.
Then the Rug — and Why the COT Is Lagging the Damage
Here is the anchor for anyone trading this tape: the COT reports on a lag.
The snapshot above is dated July 28; the two-session crash happened between August 1 and 4.
So the positioning the market can currently see still shows specs near maximum length — it does not yet show the liquidation. Friday's report (data as of August 4) is where the forced unwind will finally appear.
Until then, treat the visible COT as understating how offside those longs now are, which means the downside still has fuel that the tape has only partly discharged.
The Structural Bear Beneath the Headline
Strip out the geopolitics and the backdrop is still heavy.
OPEC+ has completed the unwind of its 2023 supply cuts, restoring barrels into a market the EIA already expects to build. The agency's latest Short-Term Energy Outlook sees inventory accumulation dragging Brent to an average near $74 in the third quarter and roughly $65 across 2027, with shut-in production returning toward pre-conflict levels.
In other words, the diplomacy is not creating a bear case — it is removing the one factor that was masking it.
The Tail Risk Cuts Both Ways
The offset is that this conflict has flared before. An earlier U.S.–Iran understanding gave way to renewed escalation and the very premium now unwinding, and forecasters still peg an unusually wide August range that stretches well into the triple digits on the high side.
A stalled negotiation or a single security headline out of the strait can snap the premium back — and with specs stale-long and fresh shorts layering in on the way down, that reversal would be a squeeze, not a drift.
This is a market to trade with defined risk in both directions, not to fade with conviction.
Technical Outlook - Charting Oils Path Ahead
Oil (CL) Four-Hour Chart, August 5, 2026
Source: TradingView
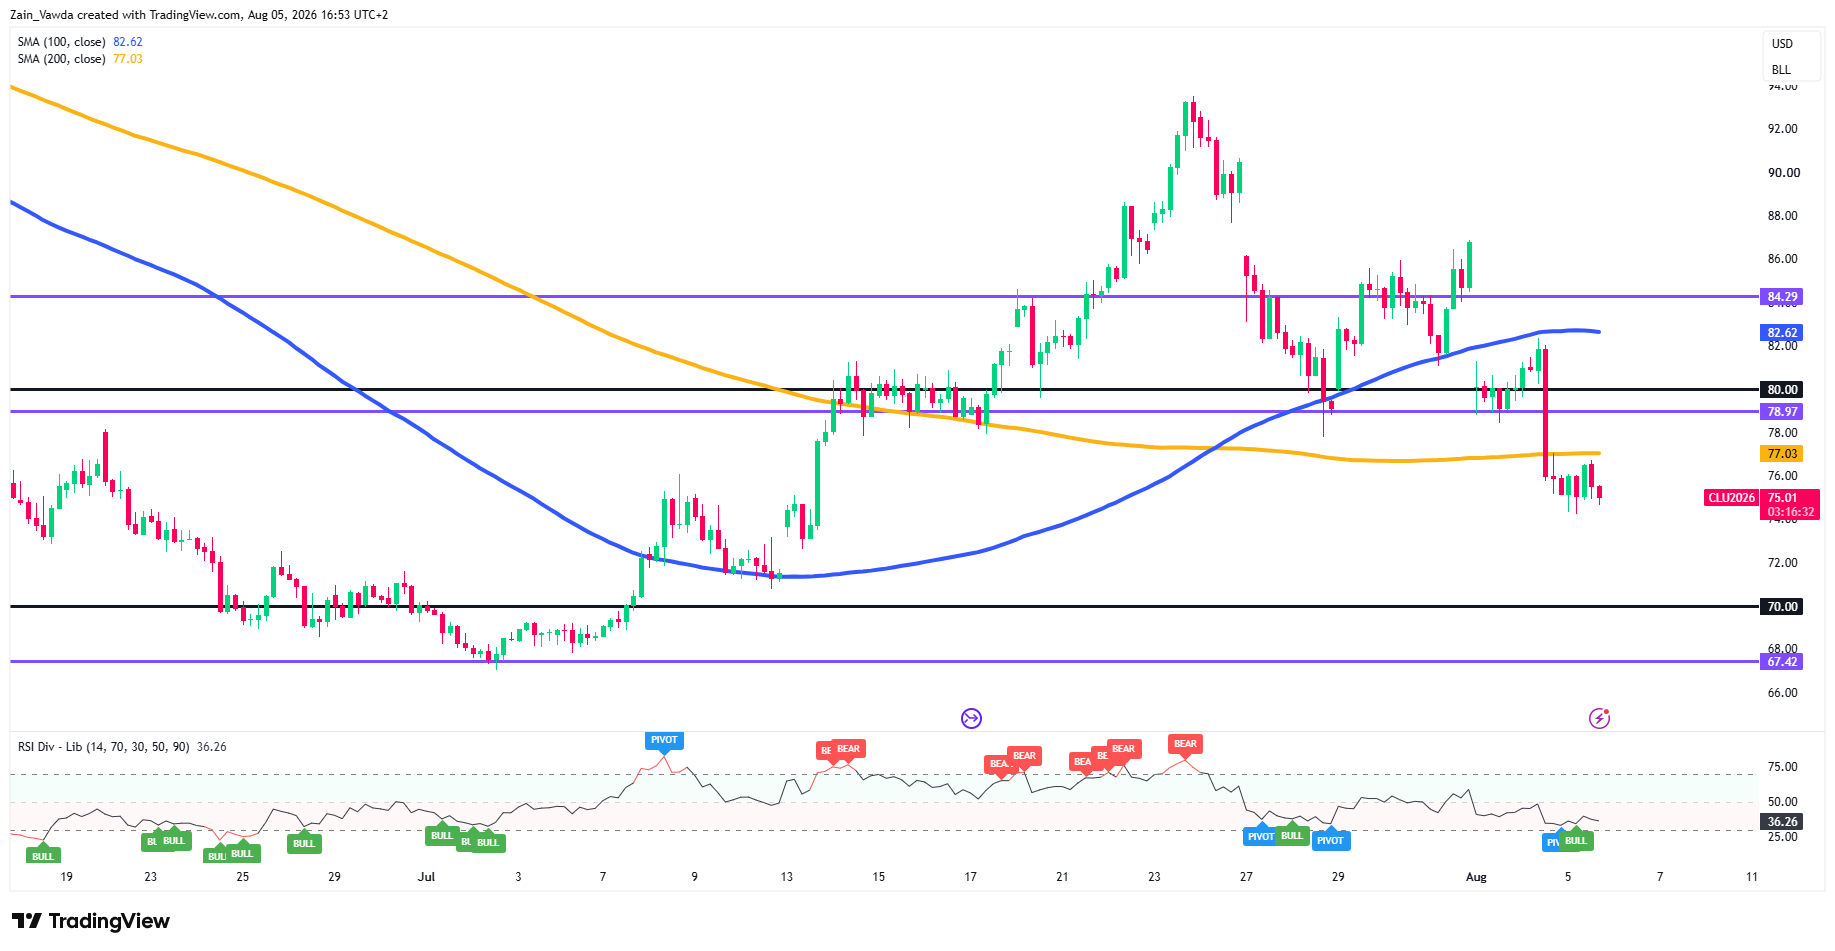
On the H4, oil's entire war-premium round-trip is now complete.
CL topped near $94 on the July 23–24 spike, rolled over for a week, and Tuesday's waterfall sliced through the $80 handle, the $78.97 pivot and the 200-MA ($77.03) in a single leg — a decisive structural break, not a wobble.
Price sits at $75.01 with RSI at 36, below every key average and firmly bearish.
The map from here is clean: $77–$78.97 is now stacked overhead resistance, while the next genuine demand shelf is the $70 round number, then the $67.42 base that launched the prior rally.
Oil (CL) One-Hour Chart, August 5, 2026
Source: TradingView
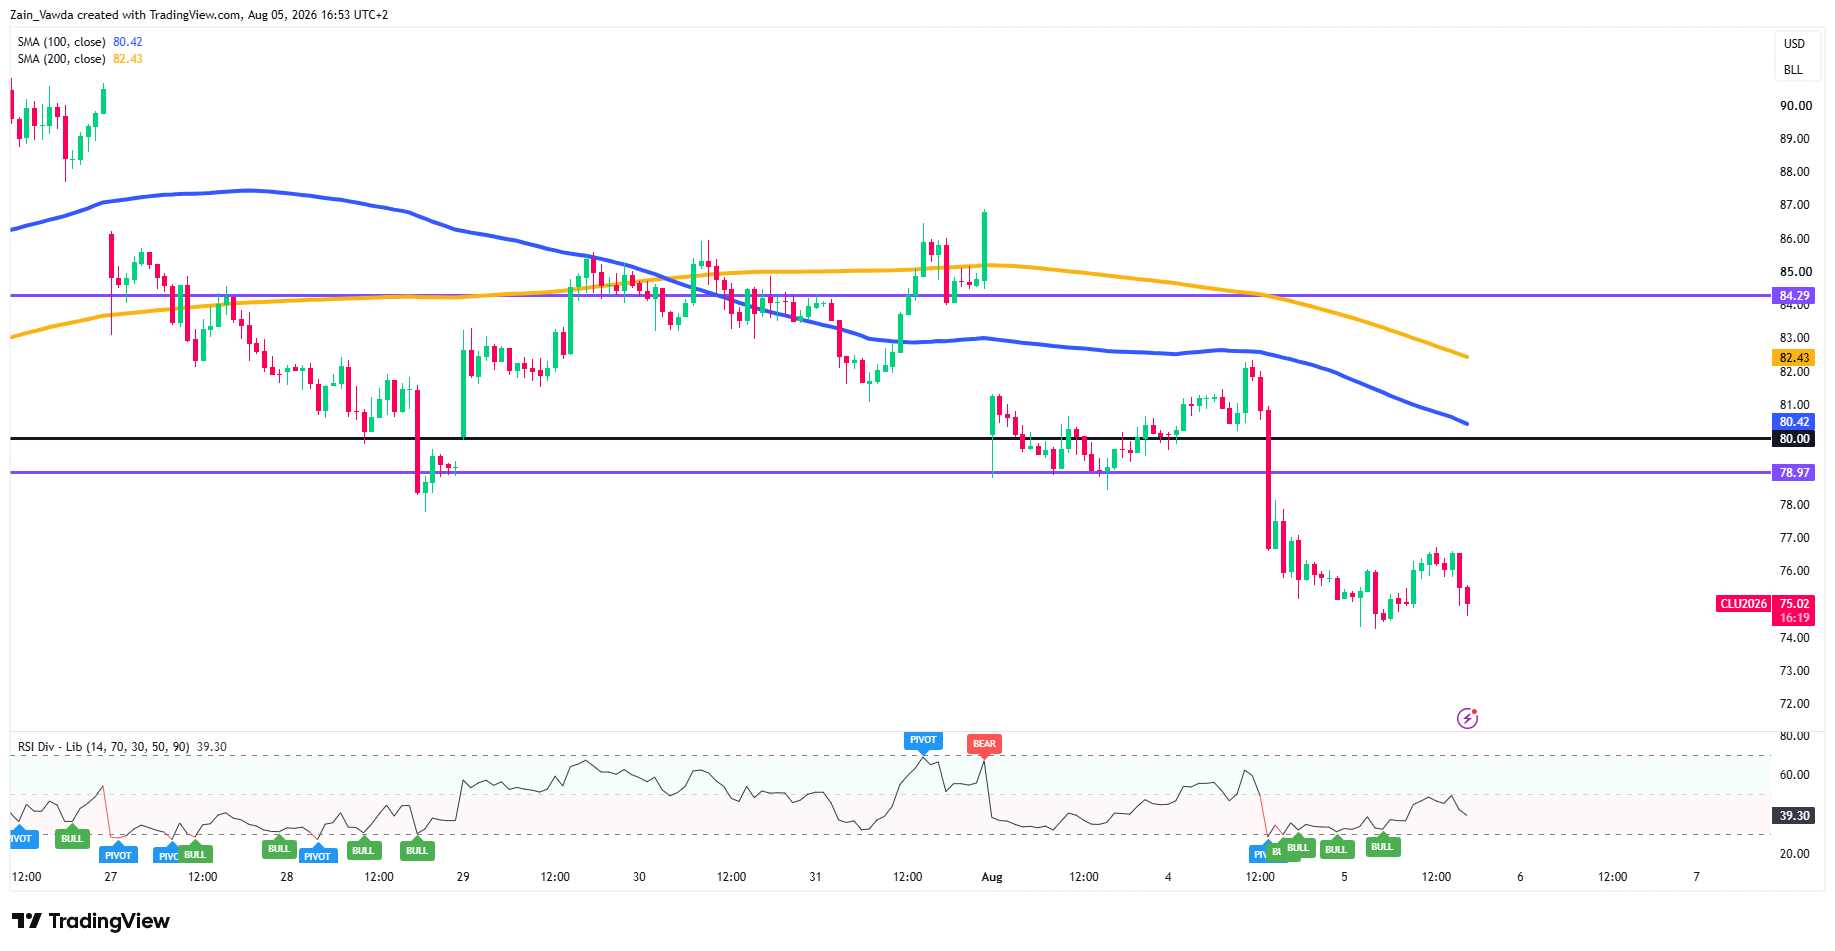
Dropping to the H1, the market is basing between $74 and $76.5 after the flush.
RSI has bounced off oversold (39) with fresh bull pivots but remains capped under 50, and the H1 100/200-MAs ($80.42/$82.43) sit far overhead and sloping down — so every rally is a counter-trend move until proven otherwise.
Treat $74 as the near-term floor: hold it and the base can grind toward $77; lose it and $72, then the H4's $70 target, open up.
This stays a dead-cat bounce until $78.97 is reclaimed.


