
For most of the last three years the intermarket chain was reliable enough to trade mechanically.
Oil spikes on a supply shock, growth expectations deteriorate, the market prices Fed cuts, the dollar softens. Crude up, dollar down.
That relationship is currently inverted and the inversion is not noise. It is the direct product of a Federal Reserve whose next move is priced as a hike rather than a cut.
The Textbook That Stopped Working
Monday gives you the cleanest illustration available. WTI August dipped 0.9% to $81.74. Both faded only after Iranian spokesman Baghaei confirmed that intermediaries had continued exchanging messages with Washington through the latest round of strikes.
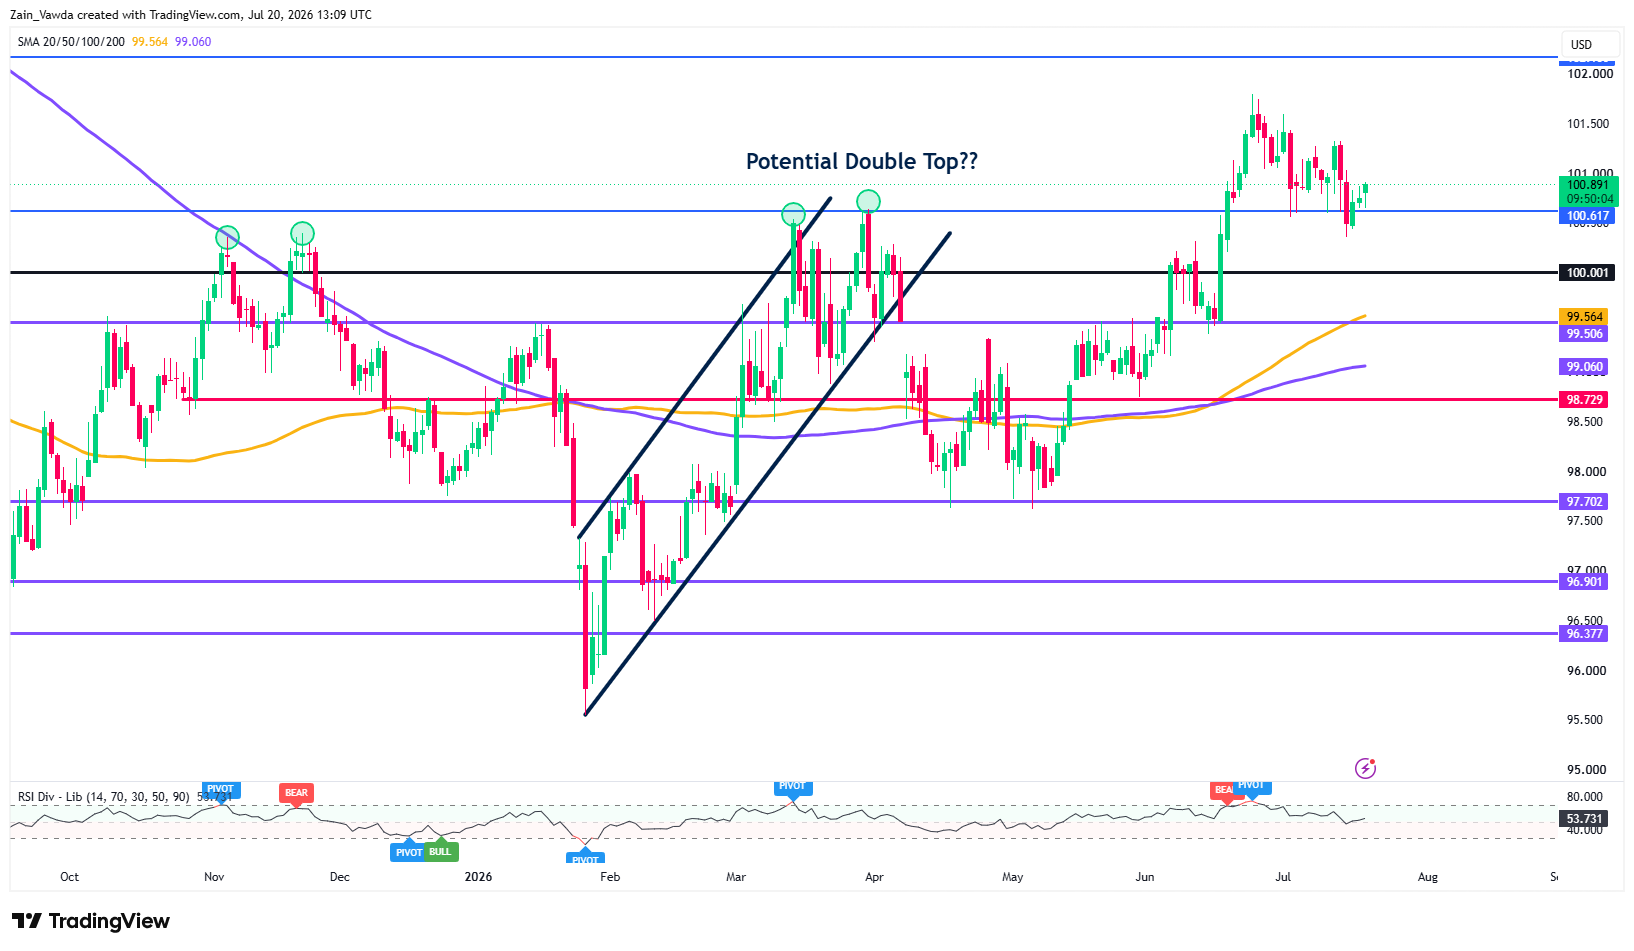
Against that, the dollar opened the week firmer near 100.8, gaining against most majors and particularly against the yen.
US Dollar Index (DXY) Daily Chart. July 20, 2026
Source: TradingView
Rewind a week and the picture is starker. Crude rose more than 10% as hostilities intensified and commercial traffic through the Strait of Hormuz stayed limited under the reinstated naval blockade.
The dollar did not fall through any of it. Both legs rose together. Anyone running a crude-long, dollar-short pairing on the old logic spent the week paying for the privilege on both sides.
The Transmission Channel Has Changed
Under a cutting Fed, an energy shock resolves through demand destruction: higher pump prices squeeze the consumer, growth forecasts get marked down, the curve prices easing, and the dollar gives back its carry advantage.
Under Kevin Warsh's Federal Reserve the chain terminates one link earlier. The shock never gets as far as the growth channel because it is intercepted by the inflation mandate first.
June CPI showed exactly how mechanical this has become. Headline fell 0.4% month over month, the largest monthly decline since April 2020 dragging the annual rate to 3.5% from May's 4.2%.
But the energy index did essentially all of the work, slumping 5.7% on the month while still running 15.7% higher year over year, with gasoline up 26.7%. Warsh's response to the print was pointed: "That is not my view," he said of any reading that the job was done.
If energy is the swing factor in the inflation print in both directions, then a crude rally is read straight into the hike distribution.
Markets now price roughly a 53% chance of a September hike, up from 47% a day earlier, and rate futures imply more than two-thirds of the market positioned for a hike by year-end.
Higher oil, higher hike odds, steeper front end, stronger dollar. The sequence is short and it is currently intact.
What It Costs You Downstream
The consequences run further than the DXY chart. Commodity-currency assumptions invert alongside it: CAD conventionally strengthens with crude, but when the USD leg is being driven by the same barrel that is supposed to support the loonie, USD/CAD can rally with WTI rather than against it.
The metals complex is caught the same way. Gold near $4,010 sits roughly 28% below its January record of $5,595, and with 10-year TIPS at 2.35% the binding constraint is the real yield, not the war headline.
Traders buying gold futures for the geopolitics have spent three months being right on the narrative and wrong on the position.
Where the Inversion Breaks
This holds only while the Fed's reaction function stays inflation-dominant.
Two things would flip it back. The first is evidence the energy shock is destroying demand rather than merely raising prices. Thursday's jobless claims and Friday's flash PMIs are the first tests, and they are the last meaningful macro inputs before the Fed meets.
The second is a credible ceasefire. Note that oil remains well below its April and May peaks even at nine consecutive days of strikes, which suggests energy markets are already looking past Hormuz toward alternative export routes.
The war premium is being repriced downward even as the war continues.
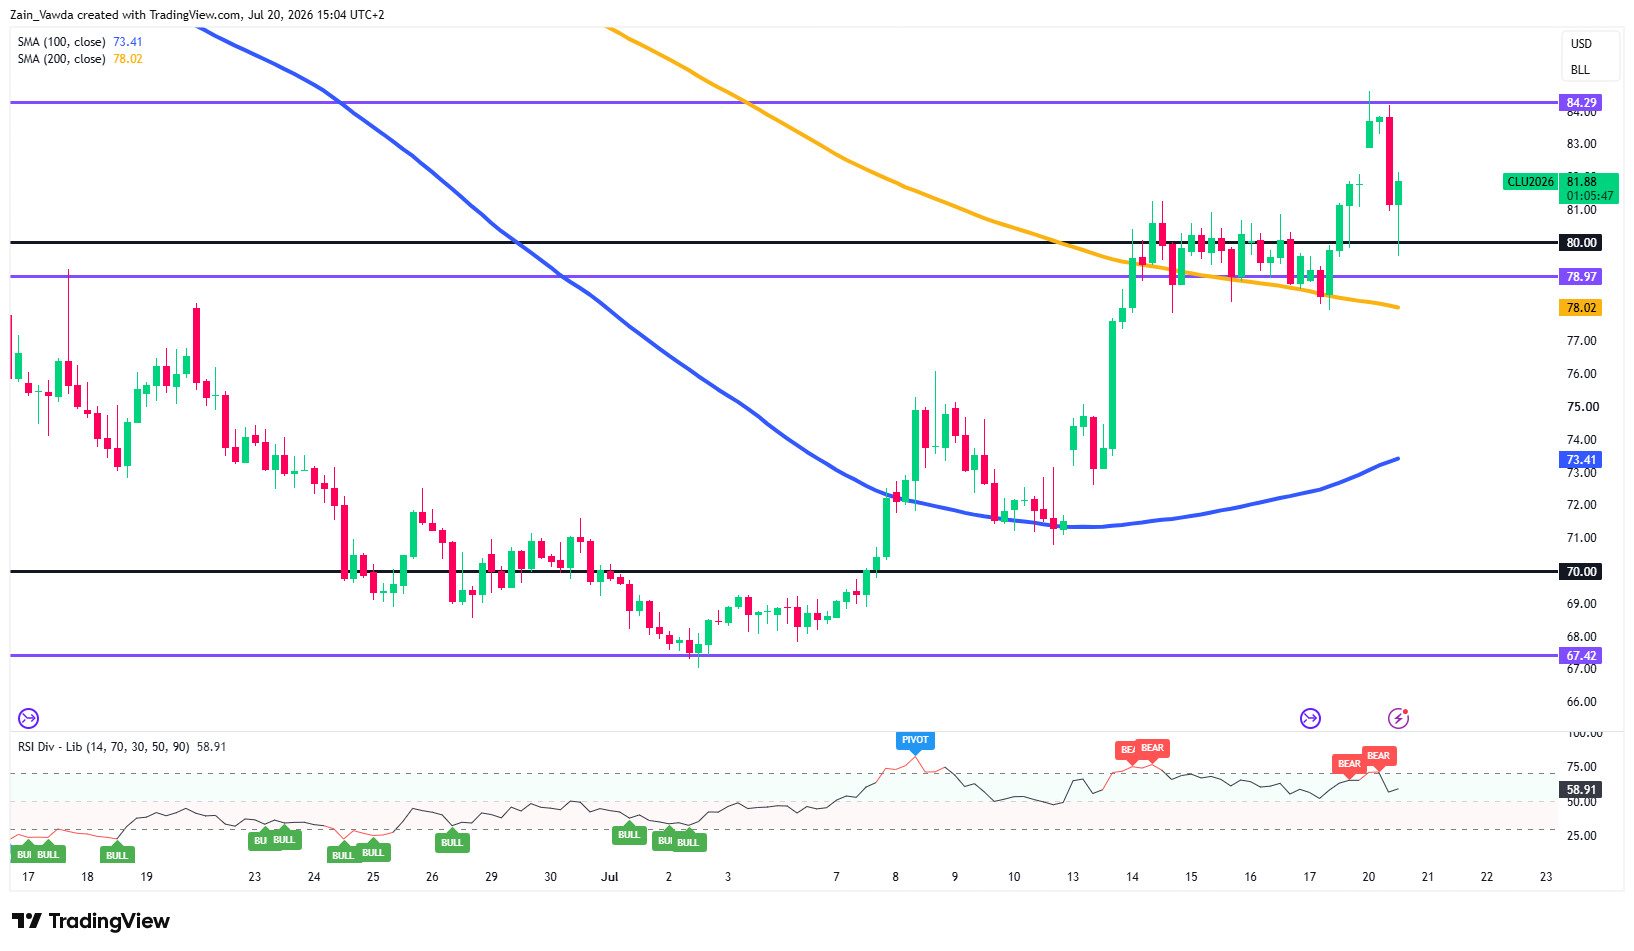
Oil Futures Four-Hour Chart, July 20, 2026
Source: TradingView
Oil's Hormuz-driven rally stalled at 84.29, where an aggressive rejection candle erased most of Friday's advance. Price now sits at 81.88 after wicking back toward the 80.00 handle — the first real test of the breakout zone since the 200-MA (78.02) was reclaimed on July 14.
RSI at 58.91 has printed successive bearish divergences into the highs, warning that momentum is lagging price. That argues for consolidation rather than immediate continuation.
Bulls need a 4H close back above 84.29 to open the next leg.
Failure to hold 80.00 exposes 78.97, with the rising 200-MA the line separating a pullback from a reversal.
The 100-MA at 73.41 turning higher keeps the broader trend constructive.
To gain an edge in your trading, take a look at the positioning edge tool on MarketFramework.


