The Federal Reserve is expected to raise interest rates on Wednesday for the first time in three years. Markets have all but priced it in, so the decision itself is unlikely to be the story. What moves the S&P 500 and Nasdaq 100 will be the summary of economic projections, vote split, and how hawkish Chair Kevin Warsh sounds afterwards.
What’s Actually on the Table
A quarter-point hike would lift the target range to 3.75%–4.00%. CME FedWatch put the odds at roughly 92%, so a move is close to fully expected.
September is a projection meeting, which means the Fed also releases its Summary of Economic Projections and the “dot plot”, the grid showing where each official sees rates heading. Warsh has stopped submitting his own dot, but the other members still do, and that grid is where the real signal sits: how many more hikes are planned after this one?
The case for hiking is inflation. Energy costs have jumped, Brent crude is near $107 and headline inflation is running around 3.4%, keeping price pressure alive.
There is also politics. President Trump has pushed for lower rates, so a pause now could look like the Fed caving to pressure. That would risk pushing long-term bond yields, already near their highest since 2007 even higher.
For Warsh, hiking is the lesser of two evils.
What It Means for S&P 500 and Nasdaq 100 Futures
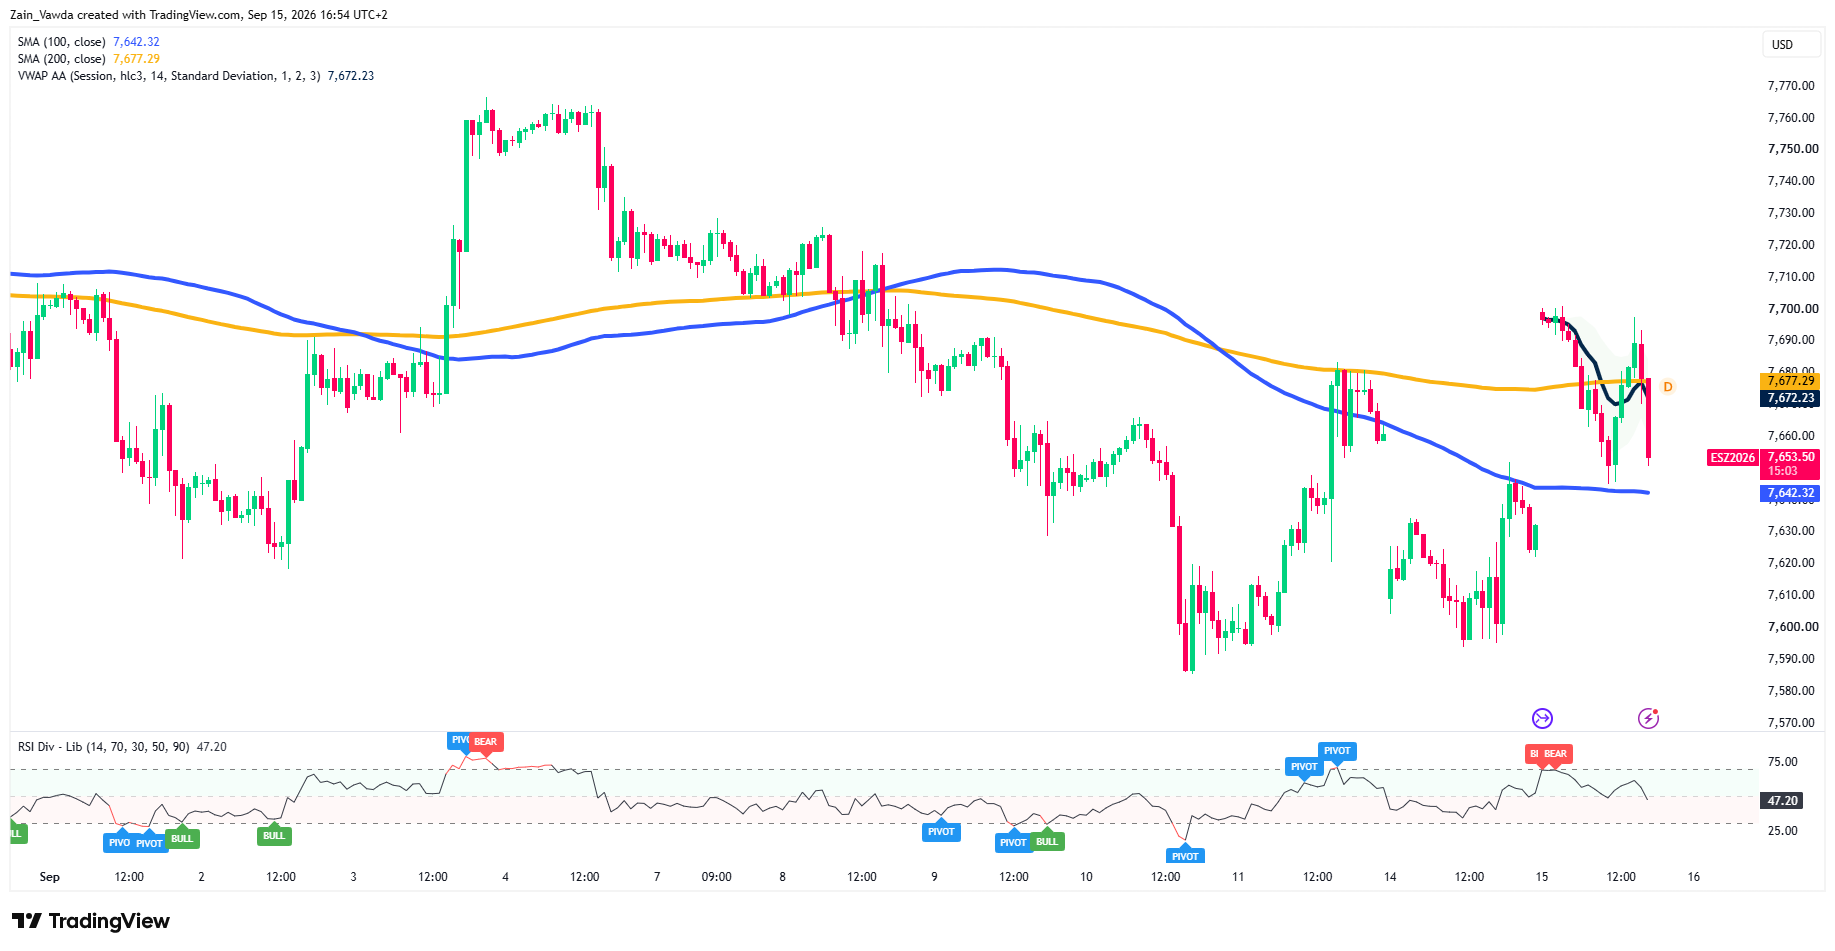
Both index futures head into the meeting coiled tightly, which is normal before a big event. On the hourly charts, price has compressed just under a wall of moving averages.
S&P 500 (ES) One-Hour Chart, September 15, 2026
Source: TradingView
S&P 500 futures (ES) are trading around 7,653, caught between the 100-period moving average near 7,642 (support) and a ceiling built from the 200-period average and session VWAP at 7,672–7,677 (resistance).
A clean break above that ceiling opens the door back toward 7,690 and the early-September highs near 7,770. A drop below 7,642 puts the 7,600–7,590 zone back in play.
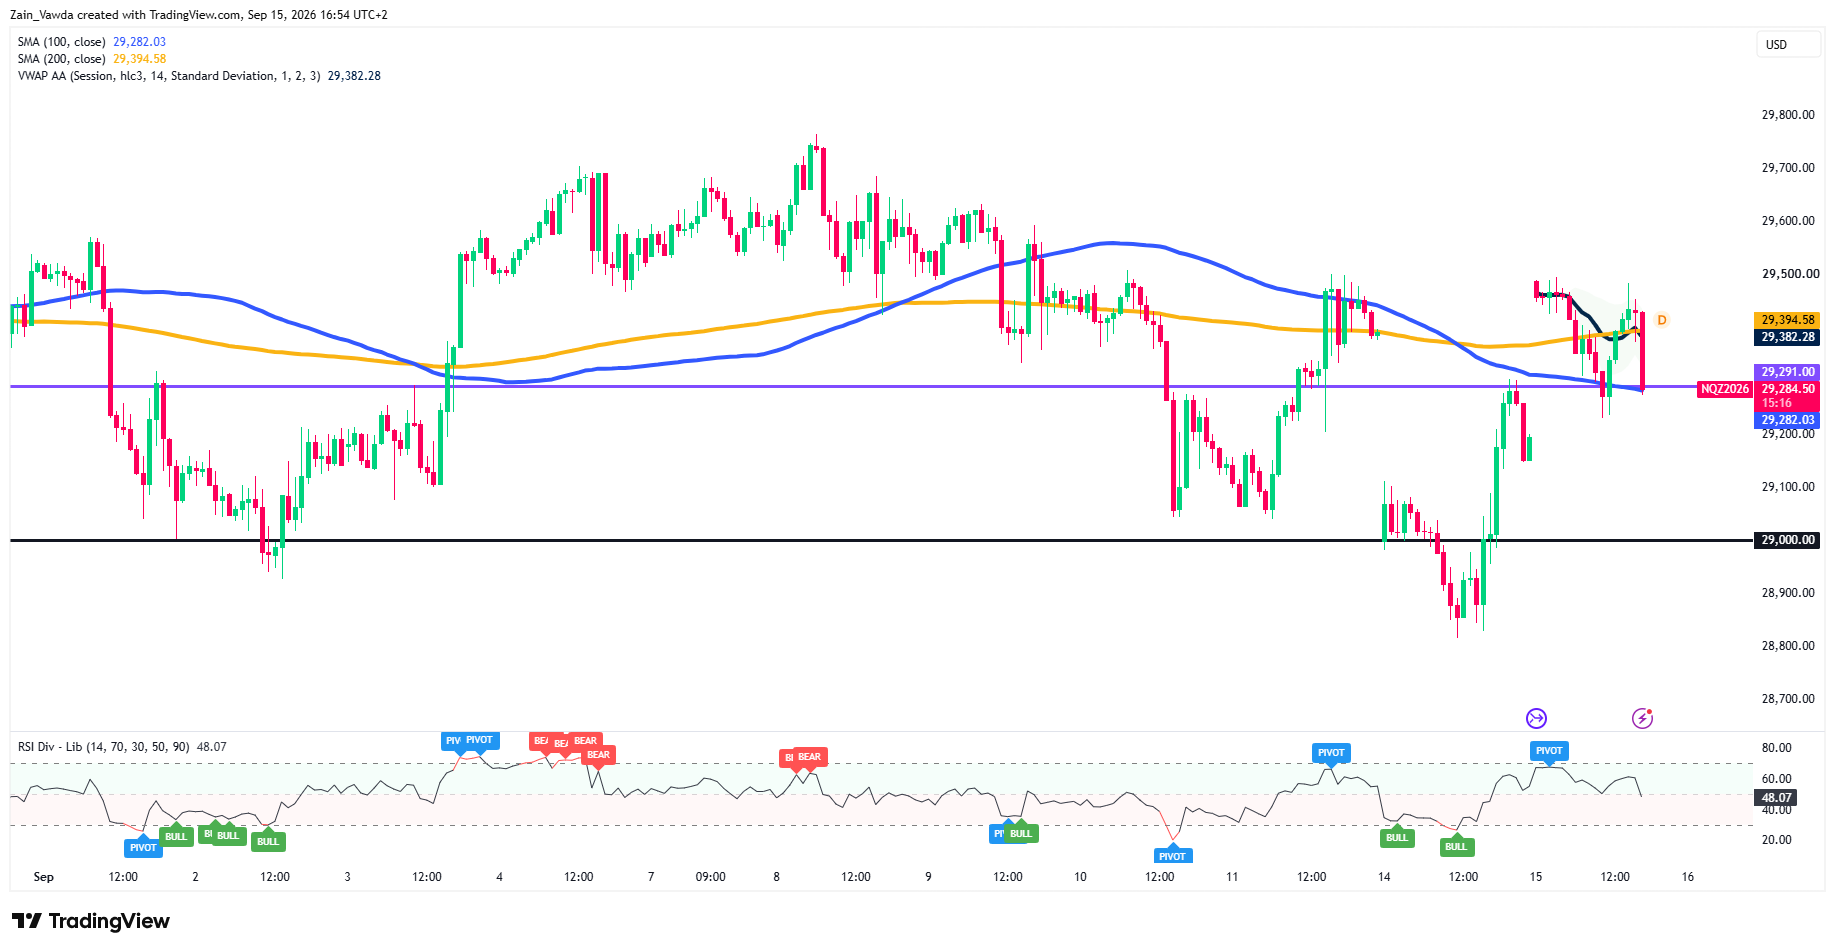
Nasdaq 100 (NQ) One-Hour Chart, September 15, 2026
Source: TradingView
Nasdaq 100 futures (NQ) are sitting right on their pivot near 29,291 and the 100-period moving average at 29,282, with the same kind of ceiling overhead the 200-period average and VWAP at roughly 29,382–29,395. Above there, 29,500 then 29,800 come into view.
The level that matters most on the downside is the round 29,000 handle, the floor that has held through recent selling.
Momentum on both is neutral (RSI in the high-40s), which fits a market waiting for a trigger. The Fed is that trigger.
Three Ways the FOMC Can Go
| Scenario | Trigger | S&P 500 (ES) | Nasdaq 100 (NQ) |
|---|---|---|---|
| Bull | Dots show few / no further hikes; Warsh soft on more tightening | Break 7,677 → 7,690 → 7,720 | Reclaim 29,395 → 29,500 → 29,800 |
| Base | 25bp hike; dots imply one more in 2026; Warsh firm on inflation | Chop 7,642–7,677, then trend resumes | Hold 29,282–29,395 range; 29,291 pivot decides |
| Bear | Dots signal multiple further hikes; yields spike | Lose 7,642 → 7,600 → 7,590 | Break 29,282 → 29,000 test |
Trader Positioning Data
It might be worth keeping an eye on MarketFrameworks Positioning Edge Tool which provides insight on which direction profitable traders are leaning.
As things stand, both S&P 500 (ES) and Nasdaq (NQ) are flashing critical "Extreme Bearish Divergence" signals as smart money aggressively positions for downside risk.
On ES (7,653.50), profitable traders are overwhelmingly short at 83% (17% long), a massive 33% gap compared to unprofitable traders who remain neutral at 50/50.
A similar divergence unfolds on NQ (29,288), where profitable traders are 31% more short (57% short) while unprofitable traders are heavily trapped long at 73%.
Performance metrics highlight this divide: profitable accounts are sitting on positive average trades, whereas unprofitable NQ traders are underwater.
Across both indices, profitable traders are heavily short-biased, while unprofitable accounts are holding the long side into potential weakness.
This could change ahead of the meeting and is worth keeping an eye on.